Explore Books on
land area
1-18 of 18 Books
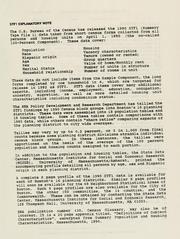
Allston-brighton planning district, 1990 population and housing tables with comparisons to Boston city share and selected 1980 data, U.S. census (stf1)
Allston-brighton planning district, 1990 population and housing tables with comparisons to Boston city share and selected 1980 data, U.S. census (stf1)
By Boston Redevelopment Authority. Policy Development and Research Dept.
Hyde park planning district, 1990 population and housing tables with comparisons to Boston city share and selected 1980 data, U.S. census (stf1)
Hyde park planning district, 1990 population and housing tables with comparisons to Boston city share and selected 1980 data, U.S. census (stf1)
By Boston Redevelopment Authority. Policy Development and Research Dept.
Population density of Boston, by planning district, 1950, 1960, 1970 and 1980
Population density of Boston, by planning district, 1950, 1960, 1970 and 1980
By Boston Redevelopment Authority
Fenway-kenmore planning district, 1990 population and housing tables with comparisons to Boston city share and selected 1980 data, U.S. census (stf1)
Fenway-kenmore planning district, 1990 population and housing tables with comparisons to Boston city share and selected 1980 data, U.S. census (stf1)
By Boston Redevelopment Authority. Policy Development and Research Dept.
Jamaica plain planning district, 1990 population and housing tables with comparisons to Boston city share and selected 1980 data, U.S. census (stf1)
Jamaica plain planning district, 1990 population and housing tables with comparisons to Boston city share and selected 1980 data, U.S. census (stf1)
By Boston Redevelopment Authority. Policy Development and Research Dept.
Back bay-Beacon Hill planning district, 1990 population and housing tables with comparisons to Boston city share and selected 1980 data, U.S. census (stf1)
Back bay-Beacon Hill planning district, 1990 population and housing tables with comparisons to Boston city share and selected 1980 data, U.S. census (stf1)
By Boston Redevelopment Authority. Policy Development and Research Dept.
Charlestown planning district, 1990 population and housing tables with comparisons to Boston city share and selected 1980 data, U.S. census (stf1)
Charlestown planning district, 1990 population and housing tables with comparisons to Boston city share and selected 1980 data, U.S. census (stf1)
By Boston Redevelopment Authority. Policy Development and Research Dept.
South Boston planning district, 1990 population and housing tables with comparisons to Boston city share and selected 1980 data, U.S. census (stf1)
South Boston planning district, 1990 population and housing tables with comparisons to Boston city share and selected 1980 data, U.S. census (stf1)
By Boston Redevelopment Authority. Policy Development and Research Dept.
East Boston planning district, 1990 population and housing tables with comparisons to Boston city share and selected 1980 data, U.S. census (stf1)
East Boston planning district, 1990 population and housing tables with comparisons to Boston city share and selected 1980 data, U.S. census (stf1)
By Boston Redevelopment Authority. Policy Development and Research Dept.
Central Boston planning district, 1990 population and housing tables with comparisons to Boston city share and selected 1980 data, U.S. census (stf1)
Central Boston planning district, 1990 population and housing tables with comparisons to Boston city share and selected 1980 data, U.S. census (stf1)
By Boston Redevelopment Authority. Policy Development and Research Dept.
Roslindale planning district, 1990 population and housing tables with comparisons to Boston city share and selected 1980 data, U.S. census (stf1)
Roslindale planning district, 1990 population and housing tables with comparisons to Boston city share and selected 1980 data, U.S. census (stf1)
By Boston Redevelopment Authority. Policy Development and Research Dept.
West Roxbury planning district, 1990 population and housing tables with comparisons to Boston city share and selected 1980 data, U.S. census (stf1)
West Roxbury planning district, 1990 population and housing tables with comparisons to Boston city share and selected 1980 data, U.S. census (stf1)
By Boston Redevelopment Authority. Policy Development and Research Dept.
South Dorchester planning district, 1990 population and housing tables with comparisons to Boston city share and selected 1980 data, U.S. census (stf1)
South Dorchester planning district, 1990 population and housing tables with comparisons to Boston city share and selected 1980 data, U.S. census (stf1)
By Boston Redevelopment Authority. Policy Development and Research Dept.
Mattapan planning district, 1990 population and housing tables with comparisons to Boston city share and selected 1980 data, U.S. census (stf1)
Mattapan planning district, 1990 population and housing tables with comparisons to Boston city share and selected 1980 data, U.S. census (stf1)
By Boston Redevelopment Authority. Policy Development and Research Dept.
Roxbury planning district, 1990 population and housing tables with comparisons to Boston city share and selected 1980 data, U.S. census (stf1)
Roxbury planning district, 1990 population and housing tables with comparisons to Boston city share and selected 1980 data, U.S. census (stf1)
By Boston Redevelopment Authority. Policy Development and Research Dept.
South end planning district, 1990 population and housing tables with comparisons to Boston city share and selected 1980 data, U.S. census (stf1)
By Boston Redevelopment Authority. Policy Development and Research Dept.
Open space in Boston: goals and policy recommendations
By Boston Redevelopment Authority

Block inventory, subarea: east fens (effort definition), blocks 1, 2, 3, 4, 5, 6, 7, 8, 9, 10, 11, 12, 13, 14, 15, 16, 17, 18, 19, 20, 21, 22, 23, 24
By